Log Viewer
This log viewer is a general purpose tool for viewing time series data. We needed a way to easily plot and scale serial port data for numerous embeded projects.
Download:
LogViewer V3 for Windows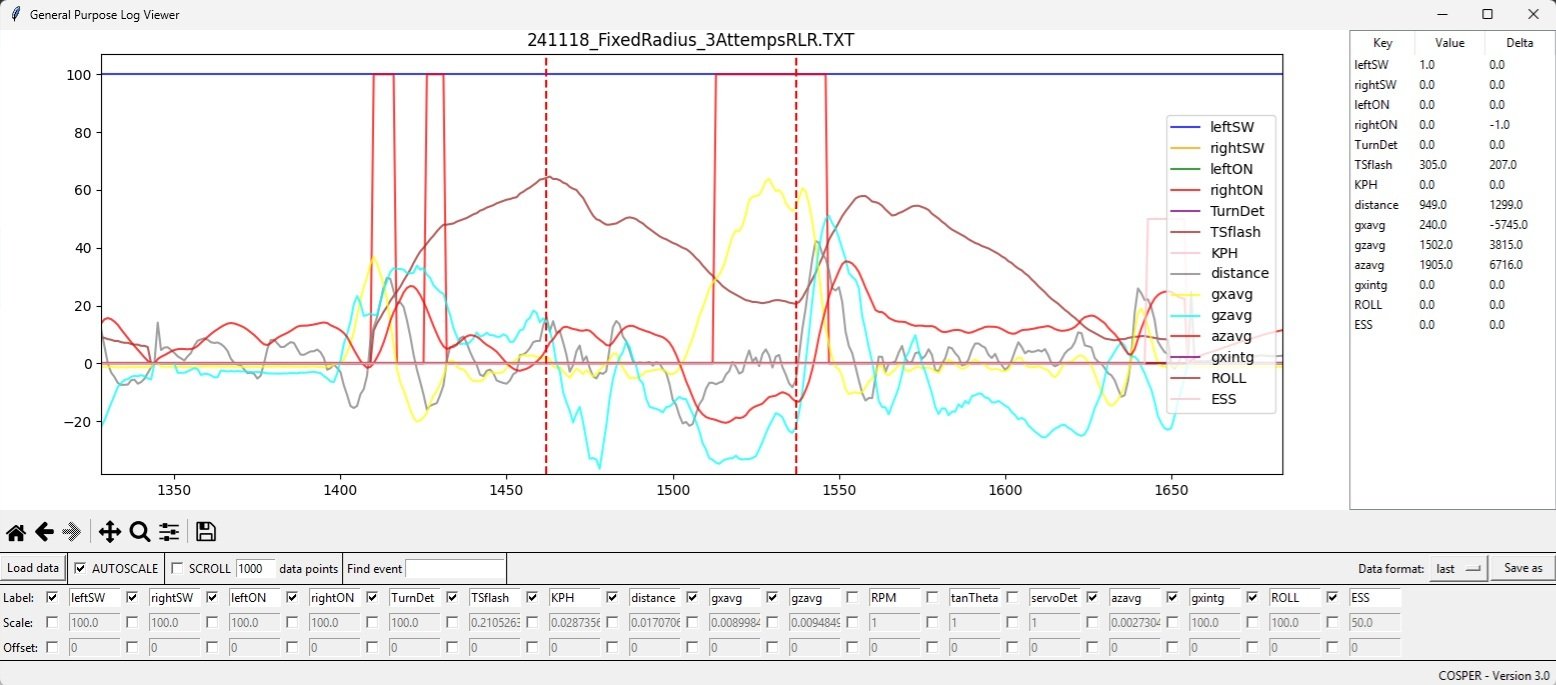
Getting Started
TBD
Features
Load Data
Software will load *.txt, *.csv and *.log files with commas or spaces as delimiters. No limit for how many data categories.
AUTOSCALE
Checking the autoscale function will try to make the data readable by normalizing it to [0,100]. Data with nevative values will be normalized to [-100,100]. The scaling factor will be displayed and can be edited by the user individually for each data category.
SCROLL
Checking the scroll function will limit the x-value on the display to n number of points, making it easier to view a sliding window of data points.
Data Format
Data-Formats can be loaded and saved. A data format contains all of the scaling values and names of each column.
Changelog
V4 (Work in progress)
- Added support for .csv and .log files
- On-click display x-value and delta x
- Left/Right (+Ctrl) arrow steps vertical marker
- Added horizontal scroll bar for data categories
- Add style selection (default, scope, etc.)
- Merged
LogViewer.pywas a class withinPlotViewer - Built-in right-click pan without needing to click navigation toolbar
- Convert logformat to JSON loader
- Added "open recent" for log files
V3
- Added individual labels, scale and offset for each plot
- Added support to load/save all of the above settings
- Locked legend to one side
- Added built-in data loading function
- Improved data processing including variable delimiter
- Added search feature for log events
- Lines now retain their color when toggling them on and off
- Added Delta numbers for measurement lines (Ctrl + click)
- Remember last directory (via log)
- Supports Linux native file dialog
V2
- Added scrolling
- Added vertical line on click with data display
Planned Additions
- Custom delimiter list